Human-centric workspace /

Analytics

Beyond the dashboard.

Real-time and historical in one product, built-in views and your own, and the whole journey of a call seen from every point it passed through. Where a business analyzes its communication, not the stats glanced at on the side of the app.


The argument

A conversation has more 
than one truth.

The same call can come in through an IVR, wait in one queue, bounce to another, and finally reach an agent. Counted once at the end, it tells you almost nothing. Analytics lets you follow it the whole way and look at it from any point on the path: the IVR’s view, each queue’s view, the agent’s view. Every view is there in real time and across history, the same data both ways.

What’s inside

The depth a basic dashboard can't reach.

Follow the whole call, from every angle.

Trace a conversation from the IVR it entered, through each queue it passed, to the agent who took it, and view it from any of those points. See where callers route themselves and where calls drop.

Dashboards, ready-made and your own.

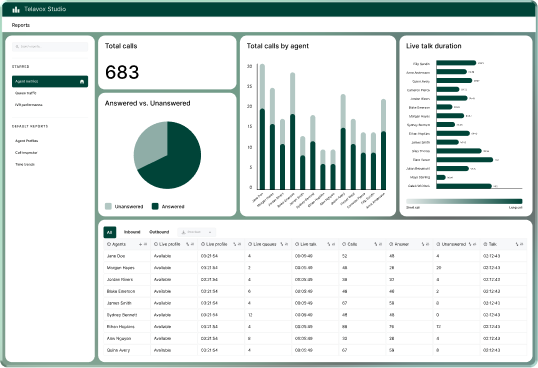
Open the product and the core views are already built: queues, missed calls, response times, team activity. Build your own dashboards on top for the questions your operation actually asks.

Real time and history, the same data.

Everything you watch live, you can study historically, the same metrics and views, with no second tool and no gap between the two.

Built to run staffing and service.

Response rates, waiting times, call duration, service levels. Filter it, drill from a summary straight into the calls underneath, and pull exactly what you need to staff correctly.

Reports, on a schedule.

Choose the data, filter by queue, user or period, and get the report at once or delivered to an inbox on the schedule you set.

Your data, in your own BI.

An API sends the raw call data into the tools the business already analyzes in, PowerBI, Tableau, its own warehouse.

Connections

The measurement layer over everything.

Analytics measures what the rest of the workspace does: the calls from the phone system, the contacts and queues from the contact center. The at-a-glance dashboards live inside those apps; this is where it gets analyzed in depth.

Why it matters to you

A tier that proves its own value.

Analytics is a value an operator sells in its own right, and one of the stickiest parts of the account. A business that runs its reporting on you, and keeps its history with you, does not give that up easily. It is churn protection too: the numbers show a customer exactly what your platform is doing for them.

Proof

In production, measured every day.

The analytics runs today with operators and the businesses they serve, turning real call and contact data into the views they run on. Telavox runs its own operation on the same product.

Nema, Faroe Islands

Voiceflex, UK

Tre, Sweden